Overview
The performance test is executed on KIE Server so it actually measures performance of the jBPM as a running service instead of focusing on raw execution of the APIs. So anyone can perform this tests by following the instructions at the end of this article.
Environment
The test has been executed on:
-
community 7.8.0 single zip distribution that you can download on jbpm.org
-
WildFly 11
-
Postgres data base
-
-
hardware
-
macOS 10.13.4
-
Processor Intel Core i7 2,3 GHz
-
Memory 16GB
-
-
JMeter as the test client
All components (client, application server and database) are on the same hardware, meaning they share the resources.
Scenarios
There are three scenarios selected for this test that are executed with various concurrency settings.
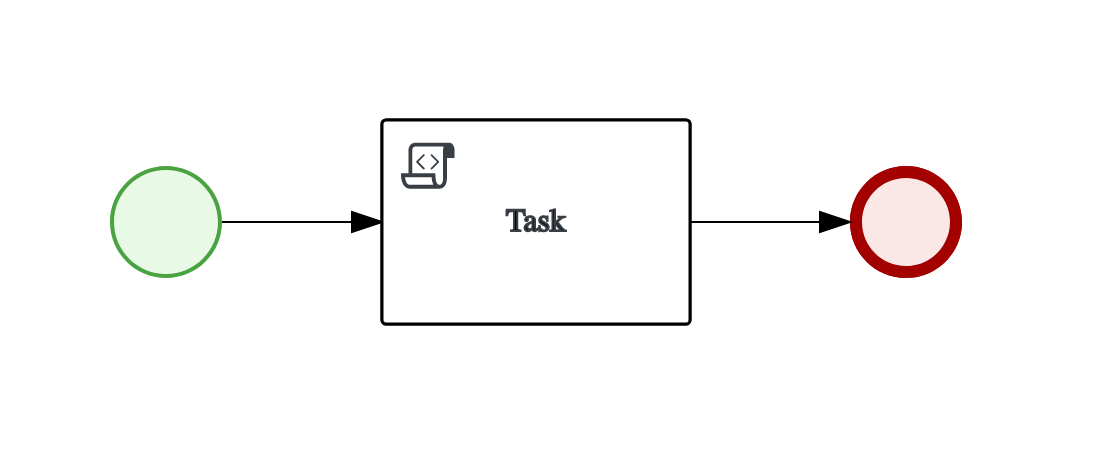
Script task
Most basic process definition that runs directly from the beginning till the end without persisting any state in between.

This test consists of just single call to KIE Server.
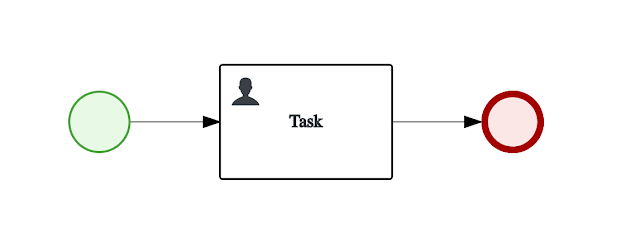
User task
User task based process that will persist its state when reaching user task activity. Completion of the task is done in another call.

This test consists of three calls to KIE Server:
-
start process
-
get tasks for given process instance
-
complete first task
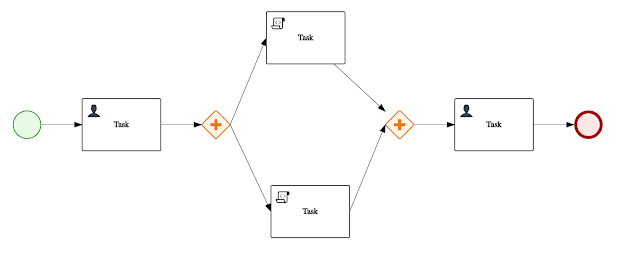
Parallel script and user tasks
More advanced process definition that combines both user and script tasks with parallel gateways.

This test consists of five calls to KIE Server:
-
start process
-
get tasks for given process instance
-
complete first task
-
get tasks for given process instance
-
complete second task
Performance test
Tests are separated per scenario and then number of concurrent threads. The test is designed to run fixed number of process instances (1000) in the shortest possible time.
Script task execution results

Actual figures:
-
1 thread - 11 421 ms
-
4 threads - 4 428 ms
-
8 threads - 3 124 ms
Throughput:
-
1 thread - 91 instances/s
-
4 threads - 240 instances/s
-
8 threads - 361 instances/s
User task execution results

Actual figures:
-
1 thread - 64 439 ms
-
4 threads - 18 397 ms
-
8 threads - 13 927 ms
Throughput:
-
1 thread - 16 instances/s
-
4 threads - 52 instances/s
-
8 threads - 72 instances/s
|
Note
|
throughput is for complete process instance execution including completion of user task |
Parallel script and user tasks execution results

Actual figures:
-
1 thread - 153 543 ms
-
4 threads - 34 769 ms
-
8 threads - 20 426 ms
Throughput:
-
1 thread - 11 instances/s
-
4 threads - 45 instances/s
-
8 threads - 70 instances/s
|
Note
|
throughput is for complete process instance execution including completion of user tasks. |
Conclusion
The performance gain can be clearly seen when increasing threads until there is not enough resources (CPU) to handle the load. In this particular example where all components (application server, data base and test client) were running on same hardware - performance gain is smaller with 8 threads and that is because there is not enough CPU power to handle that load. Moving data base to other hardware increases throughput significantly.
These performance results show the base performance of the jBPM execution through KIE Server - meaning it adds network and marshalling overhead. The application server or hardware has not been tuned in anyway and the sample processes are simple as well. So with that said, it’s not meant to provide complete performance report but rather a base line. More advanced performance tests can be performed on dedicated hardware and with tuned application server and database for optimal performance.
Want to talk to the experts? Red Hat offers certified binaries with enterprise consulting. See services for more information.

